8 Urban Heat Island
This week we look into the Urban Heat Island Effect, policies to combat it across the world how we can use remote sensing techniques to predict, prevent and protect.
8.1 Application
8.1.1 The General Situation, What is it?
The impacts of the Urban Heat Island (UHI) effect have been difficult to ignore in recent years. Alongside rising global temperatures, higher temperatures experienced in urban areas pose a serious risk toward the health and wellbeing of urban populations. In the UK, the five-day heat wave in July 2022 was associated with 2,800 deaths in over-65s across the country as temperatures rose as high as 40C in central London (“Record Excess Deaths in UK’s Heatwave Summer” (2022) ) .
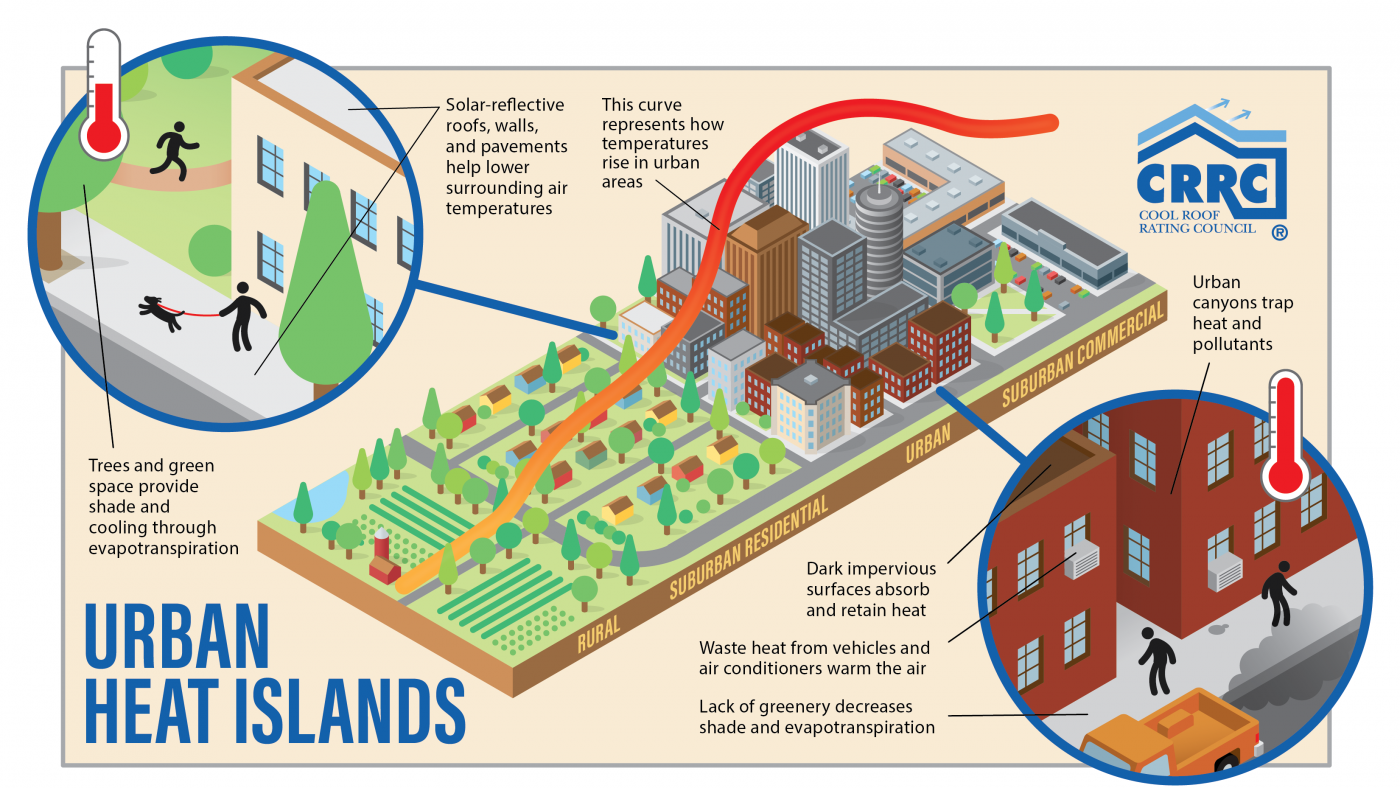
Source: Cool Roof Rating Council (n.d.)
There are various factors that contributes to UHI:
High density buildings in the urban core that replaced natural covers such as trees and natural water feature drastically reduce cities’ capacity to increase their albedo.
Dark impermeable surfaces such as tarmac roads and black roofs contributes to overheating as dark colours only absorb the heat, instead of reflecting it elsewhere.
Feedback Loop: the hotter it gets, the more energy cities will use to cool itself down. This means frequent uses of air conditioners which, in the process of generating cool air, is actively pumping out hot air onto the streets.
Want more detail? Well well well, you’re in luck:
If you’re not seeing anything there at the moment, check back later. It’s worth it – trust me.
8.2 What are the impacts?
8.2.1 Economic
Estrada, Botzen, and Tol (2017) estimated the % lost from UHI in each GHG level scenario. The lowest GHG scenario still predicts 0.71% to be lost in 2050
8.2.2 Environmental
Mentioned briefly above, the hotter it is, the more energy requires to keep people cool. Santamouris et al. (2015) found that each degree of ambient temperature rise increases the peak electricity load around 0.45 and 4.6%. Also taking into account that many countries rely on oil and gas suppliers to supply energy. And from what we experienced (and experiencing) with the geopolitics with Russia, this is bad news for the environment and the wallet.
8.3 Global Policies
Global policies like the New Urban Agenda, Sustainable Development Goals, COP26 (which is now funded by oil tycoons!) all have general references to the UHI problem, however these global framework are often vague. Which in a way is fair enough because it needs to be applicable for all nations across economic strengths and different infrastructures. These documents are also often extremely long, so not very user friendly either. But this means the responsibility falls onto nation states and city level governments.
8.4 Local Policies
| Place | Strategy | Outcomes |
|---|---|---|
| Barcelona | Superblock | Increased footfall and consumption, less pollutants, less cars, a lively walkable neigbourhood |
| Medellin | Green Corridors | transformed undefined spaces that encouraged anti-social behaviours into welcoming spaces, increase quality of life, general cooling effect– but not near where people live… |
| Sydney Western Suburbs | Turn Down the Heat Strategy | The first real guide from a city level that highlights the need to address UHI. But provided no specifics. Yes we need to mitigate and prevent, but where? how? how much? who? |
| Baltimore | tree vouchers | This pushes the responsibilities towards city dwellers, when in fact large scale top down policies needs to be enforced by the government |
| Fremantle | Urban forest Plan | yay for data driven policy! But they only used 1 month’s data. Really should be using aggregate. |
| Perth Met Area | 1955 requirement for 10% of open space | Open space != green space… |
When thinking about policy, we need to consider what the effect are. Are we aiming for equity, equality or justice? Are we talking about giving everyone equal access to cool areas, or are we actively lifting those who are already disadvantaged?
8.5 Application
Li et al. (2022) wrote a paper that pretty much summarises this week content, exploring the intersection between UHI, policy and injustice. Li measured the effects of UHI using admission to A&E due to heat related emergencies and its relations to historical redlining in Texas.
Land Surface Data: Taken from ECO2LSTE product, ranging from June to August 2018-2020. This data is to capture heat exposure in different areas. Daytime and nighttime LST are both captured.
Social Vulnerability Factors: Taken from American Community Survey 2015-2019. Elderly, non-white population, low income population, population who do not speak English well, population who live alone. These are used as control variables to make sure the analysis is measuring the relationship between redlining areas and LST.
Heat-related Emergency Department Visits: Provided by Texas Health Centre for statistics between 2016-2019.
Historical Redlining: Geo-rectified data from the Mapping Ineqaulity project. The spatial boundaries of the redlined zones are recalculated to ensure the zones fit the zip code tabulation area, based on 50% percentile. Resulting in 2 categories of more redline and less redline.
Methodology
OLS regression models were fitted to predict daytime and nighttime LST based on whether or not there are more or less redlining, and the spatial autocorrelation residual is examined.
Output
The Moran’s I and Spatial Lag model were both statistically significant, suggesting that the variance in LST can be explained by proportion of redlining, with coefficient of 0.0122 for daytime LST, and 0.0098 for nighttime LST.
The same analysis was done for LST and A&E heat related admission, and again a significant relationship is found.
In my opinion, however, I don’t think LST is representative of the temperature people may experience inside redlined housing. Indeed, amount of tree cover, often lacking in redlined areas can influence LST. However it is often the quality of the building, whether it is well insulated, whether it is equipped with cooling infrastructure is more of a direct measure. Further, the heat related A&E admission could very much be under represented as often those with lower economic status cannot afford a trip to the A&E.
But this study goes to show the long lasting effect of policies and how it continues to influence and maintain the structural inequalities in society. It is important to recognise that one size fit all solutions do not tend to create a just society. Instead, policy makers need to be aware of the place-based health disparities arising from historical and structural segregation and racist policies.
Day & Night UHI
An interesting aspect of UHI I’ve had interest in exploring is the UHI difference during the day and night. There have been debates on whether the UHI Effect is more prominent during the night as there is greater thermal inertial, and heat accumulated throughout the day would radiate Arellano and Roca (2021).
The map above is based on the simplified dataset created by Chakraborty and Lee (2019) using SUE algorithm. From MODIS (Moderate Resolution Imaging Spectroradiometer) images, 15 years of Land Surface Temperature data is used to calculated UHI intensity for 9500 urban clusters. Chakraborty et al. calculated both the daytime and nighttime surface UHI for their urban clusters. They found the global mean surface for daytime is 0.85C with 44% showing values greater than 1C. With nighttime, the average UHI intensity is 0.55C, with only 13% showing value greater than 1C. This is because daytime UHI is influenced by more factors (evapourative cooling, surface roughness between urban/rural, anthropocentric heat flux, thermal inertia in buildings ), whereas nighttime UHI is mainly influenced by thermal inertia and anthropocentric heat flux only!
8.6 Reflection
The Urban Heat Island Effect will only become a more serious concern as time goes on. Especially in the UK, where housing stock is one of the most poorly insulated in Europe – national and city level government need to implement measures that could alleviate effects of extreme heat in the short term (paint roofs white and tree vouchers are only short term solutions, if solutions at all!), but also suggest urban policies to build sustainable green infrastructure and retrofitting homes for higher energy efficiency. Of course, limited funding is a consistent problem within government bodies (apart from funding wars, lockdown parties, building detention centres in Rwanda etc etc ). This is why it is important to utilise data available to use to prioritised communities who are worst affected and address the fundamental problem of injustice, instead of applying a blanket solutions that only perpetuate existing inequality.
8.2.3 Social: The already disadvantaged gets it the worst
Harlan et al. (2013) conducted a comprehensive study identifying social and environmental predictors of heat vulnerability in Arizona. The study found deprived areas, especially those with majority black populations and areas of spatial deprivation , where dwellings are considered overcrowded, are particularly vulnerable to heat-related deaths.
Often, it is exactly these poor urban areas that have the least access to green and blue covers and further away from hospitals for medical assistance Prosdocimi and Klima (2020) found that risk of death is increased by 1.02% per km of distance. Hello redlining!